History of Charleston Ridge in Tallahassee, Florida
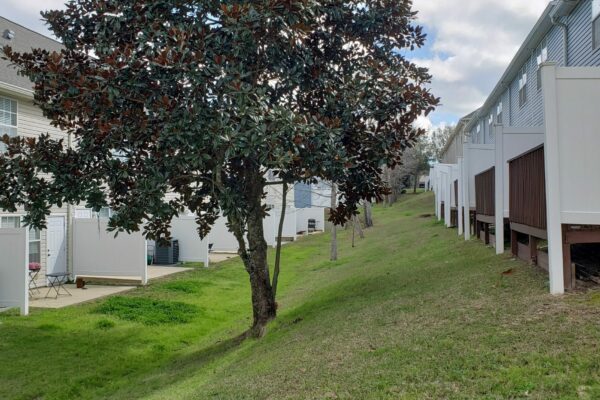
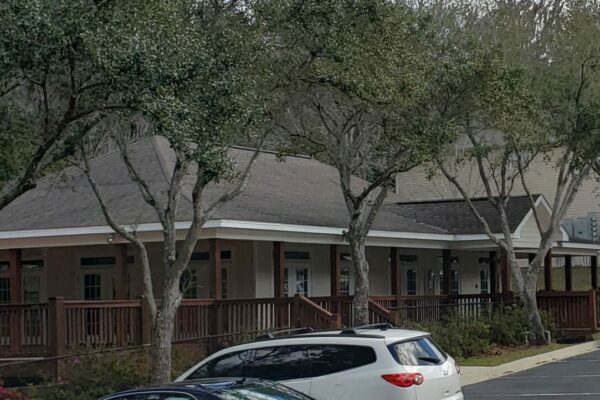
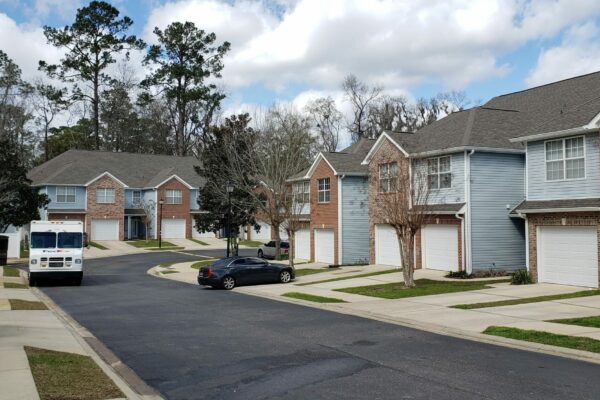
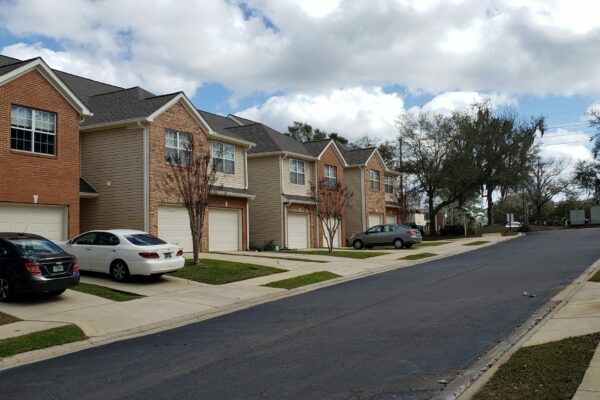
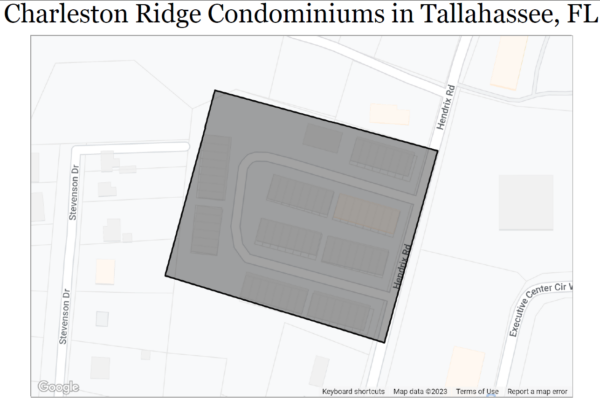
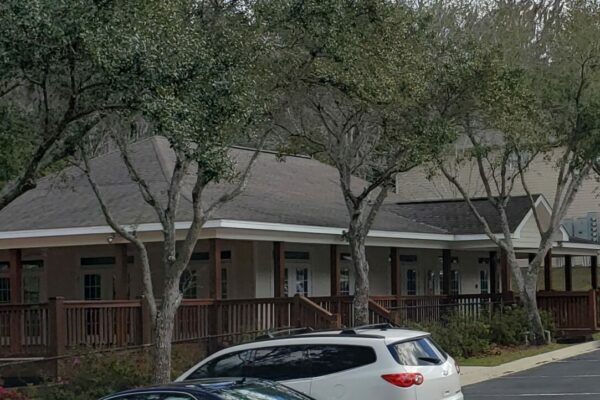
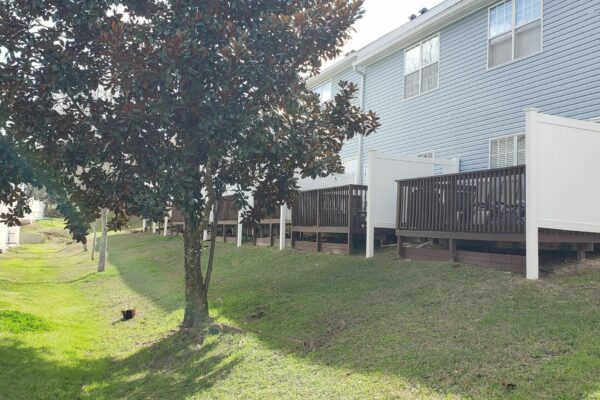
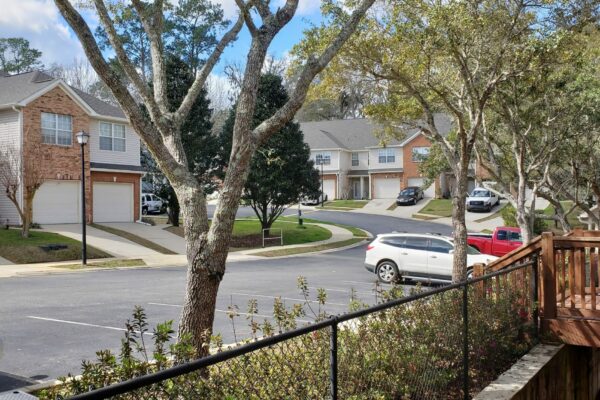
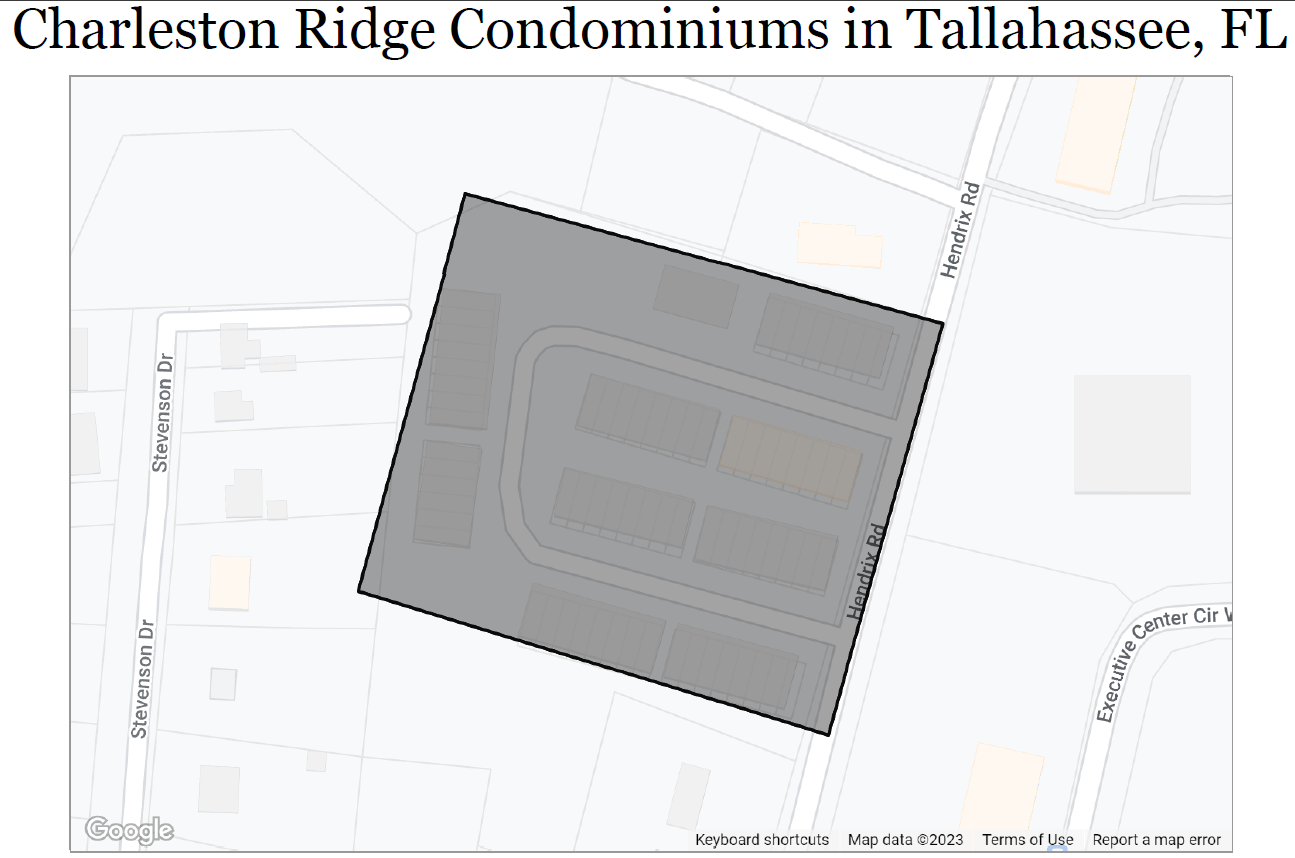
This is going to be a short blog! The Charleston Ridge Neighborhood is a community of condominiums tucked just south of the Apalachee Parkway near Capital Circle SE. There is an active homeowner’s association. The covenants and restrictions are available on their website.
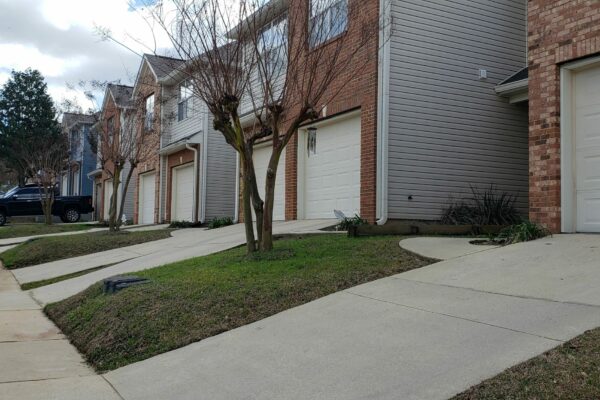
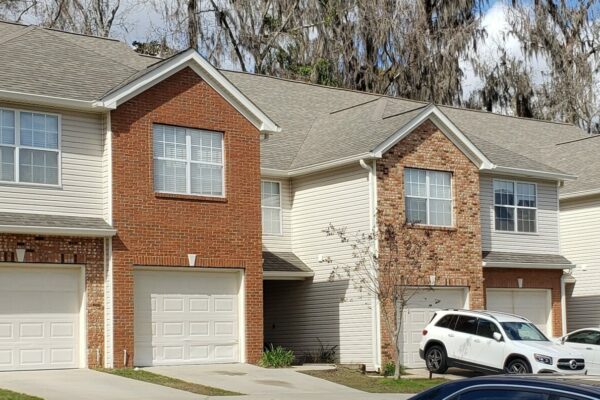
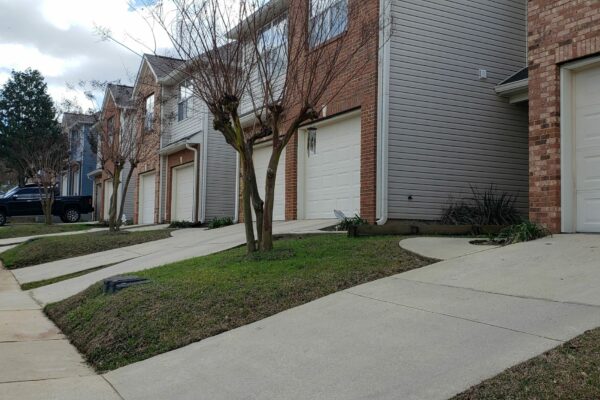
These condominiums were built in 2004. They are all around 1500 square feet with three bedrooms with a half bath. Most have three full bathrooms, but a few have two bathrooms. Most of them have a fireplace too. This is one of the few condos in Tallahassee that is financeable with an FHA mortgage. You can read more about FHA mortgages, which are common for first-time home buyers, on my buyers page.
Real Estate Stats for Charleston Ridge
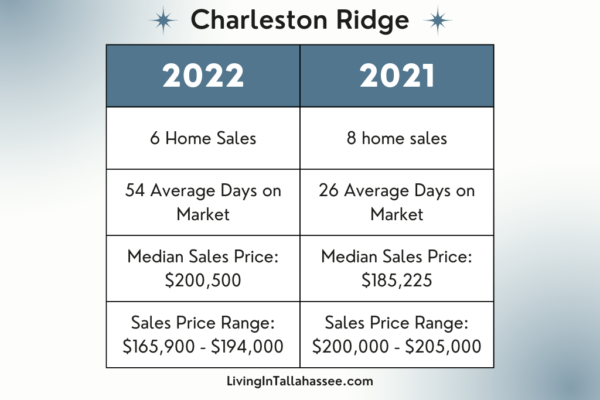
There were 6 condos sold in Charleston Ridge in 2022, and 8 were sold in 2021. The homeowners association fee is around $2,200 a year.
Even though some of these condos have not been updated in the past twenty years, the new and remodeled homes sell quickly in our Tallahassee real estate market. The average days on the market for 2022, were fifty-four, with the median being thirty-one days. There was one home on the market for over 160 days that pulled that average up. For 2021, the homes averaged 26 days on the market. The median home sale in Charleston Ridge for 2022 was $200,500. That is more than 7% higher than the home sales in 2021.
Charleston Ridge Condo Homeowners’ association websites and other relevant links:
HOA: Charleston Ridge Homeowners Association
Facebook Group: Charleston Ridge Facebook Group
This neighborhood is located in the Tallahassee zip code of 32301.
Detailed Reports for Charleston Ridge
These reports are available for licensed Realtors and pull data from various resources. Niche creates the school reports, and Esri collects the trade area data. These reports are pulled upon request and posted regularly. Please subscribe to our blog to receive updates.
The Neighborhoods
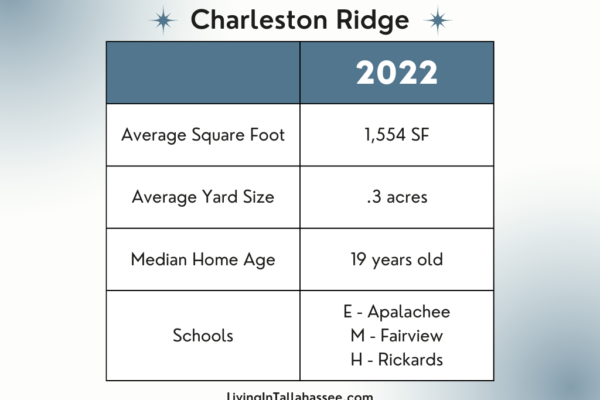
The Charleston Ridge neighborhood report includes charts and statistics about housing, people, economics, and quality of life. As of March 2023, home values rose 23% year over year. The median home age is nineteen years old, and 8% of residents are homeowners. The median age of residents is twenty-seven, with a median household income of over $50,000.
Download the January 2023 report here: Neighborhood Report for Charleston Ridge
The Real Estate Market Reports
The market activity report details the active and pending listings and recent sales in Killearn Estates. These reports will be updated periodically. If you are interested in an updated copy, contact us! See an overview of the most recent sales below.
Download your March 2023 report here: Market Activity Report for Charleston Ridge
The Trade Report
The Commercial Trade Area Report breaks down the socioeconomic and demographic segments of Killearn Estates. The primary segments, based on Esri Tapestry data, are displayed in numerical order with #1 being the most dominant. The residents’ characteristics and spending habits are explained in detail.
The biggest segment of residents in the Charleston Ridge Condo is the Young and Restless segment. These consumers are Gen Y, who have come of age and are still establishing themselves. One in five of these residents move each year, and their smartphones are a way of life. These consumers prefer densely populated neighborhoods in metropolitan areas.
Download the March 2023 report here: Commercial Trade Area Report for Charleston Ridge
Real Estate Details for Charleston Ridge
| Charleston Ridge – numbers at a glance… | |
| Income Per Capita: | $28,784 |
| Median Household Income: | $50,771 |
| Percentage of owner-occupied homes: | 8% |
| Number of 2022 DSF homes sales in MLS | 6 |
| 2021 number of home sales in MLS: | 8 |
| Range of years homes built (MLS Sold 2022): | 2004 |
| Average yearly dues listed MLS (2022): | $2,200 |
| Home prices (MLS Sold 2022): | Ranges: $200,000 – $205,000
Median $200,500 |
| Size of houses (MLS Sold 2022): | Ranges: 1,554sf
Average: 1,554sf |
| Average size of yards (MLS Sold 2022): | .3 acres |
| Sold Price Per Square Foot (MLS Sold 2022): | Ranges: $128.70 – $131.92
Median $129.02 |
For the sales in 2022, most houses had fireplaces, and none had pools.
If you are considering a move within Tallahassee or to Tallahassee, we would love to help.
Contact us at: 850-203-0209 or email me at: [email protected]
Abbe Flynn, Ketcham Realty Group
